< Previous | Contents | Next >
Net Position
Net Position
Revenues: Program Revenues: Charges for Services Operating Grants and Contributions Capital Grans and Contributions General Revenues: Property Taxes, Levied for Operational Purposes Property Taxes, Levied for Capital Projects Local Sales Taxes Flroida Education Finance Program Grants and Contributions not Restricted to Specific Programs Unrestricted Investment Earnings Miscellaneous Total Revenues Program Expenses: Instruction Student Support Services Instructional Media Services Inst and Curriculum Development Services Instructional Staff Training Instruction-Related Technology Board General Administration School Administration Facilities Acquisition and Construction Fiscal Services Food Services Central Services Student Transportation Services Operation of Plant Maintenance of Plant Administrative Technology Services Community Services Interest On Long-Term Liabilities Total Expenses Excess (Deficiency) of Revenues Over Expenditures Transfers Change in Net Position Net Position, Beginning Net Position, Ending | Changes in Net Position | |||
Governmental | Business-type | Total | ||
Activities | Activities | School District | ||
2021 2020 | 2021 2020 | 2021 | 2020 | |
$ 4,703,689 $ 10,468,605 | $ 7,988,424 $ 10,242,882 | $ 12,692,113 | $ 20,711,487 | |
55,312,307 45,792,654 | - - | 55,312,307 | 45,792,654 | |
53,091,058 38,374,100 | - - | 53,091,058 | 38,374,100 | |
149,612,844 145,183,437 | - - | 149,612,844 | 145,183,437 | |
50,742,874 47,325,942 | - - | 50,742,874 | 47,325,942 | |
36,736,646 32,123,910 | - - | 36,736,646 | 32,123,910 | |
355,870,905 337,956,712 | - - | 355,870,905 | 337,956,712 | |
150,268,033 127,070,092 | - - | 150,268,033 | 127,070,092 | |
364,759 6,846,902 | 2,831 114,994 | 367,590 | 6,961,896 | |
30,930,131 22,383,103
| 1,755 233
| 30,931,886 | 22,383,336 | |
887,633,246 813,525,457
| 7,993,010 10,358,109
| 895,626,256 | 823,883,566 | |
487,459,888 450,397,266 | - - | 487,459,888 | 450,397,266 | |
42,179,541 39,897,302 | - - | 42,179,541 | 39,897,302 | |
2,633,235 2,256,517 | - - | 2,633,235 | 2,256,517 | |
25,725,149 22,753,810 | - - | 25,725,149 | 22,753,810 | |
12,206,153 12,057,016 | - - | 12,206,153 | 12,057,016 | |
9,191,265 9,207,600 | - - | 9,191,265 | 9,207,600 | |
719,888 636,315 | - - | 719,888 | 636,315 | |
4,725,740 3,612,169 | - - | 4,725,740 | 3,612,169 | |
50,334,400 46,926,692 | - - | 50,334,400 | 46,926,692 | |
50,967,100 29,669,498 | - - | 50,967,100 | 29,669,498 | |
3,543,034 3,087,789 | - - | 3,543,034 | 3,087,789 | |
37,792,149 38,923,162 | - - | 37,792,149 | 38,923,162 | |
20,142,242 5,140,854 | - - | 20,142,242 | 5,140,854 | |
32,432,664 34,187,902 | - - | 32,432,664 | 34,187,902 | |
52,400,185 48,522,885 | - - | 52,400,185 | 48,522,885 | |
13,400,570 12,839,023 | - - | 13,400,570 | 12,839,023 | |
11,375,970 10,800,963 | - - | 11,375,970 | 10,800,963 | |
951,780 546,304 | 7,983,643 10,497,962 | 8,935,423 | 11,044,266 | |
36,593,349 19,720,118
| - -
| 36,593,349 | 19,720,118 | |
894,774,302 791,183,185
| 7,983,643 10,497,962
| 902,757,945 | 801,681,147 | |
(7,141,056) 22,342,272 | 9,367 (139,853) | (7,131,689) | 22,202,419 | |
- 44,065
| - (44,065)
| - | - | |
(7,141,056) 22,386,337 | 9,367 (183,918) | (7,131,689) | 22,202,419 | |
572,466,576 550,080,239 | 31,144 215,062 | 572,497,720 | 550,295,301 | |
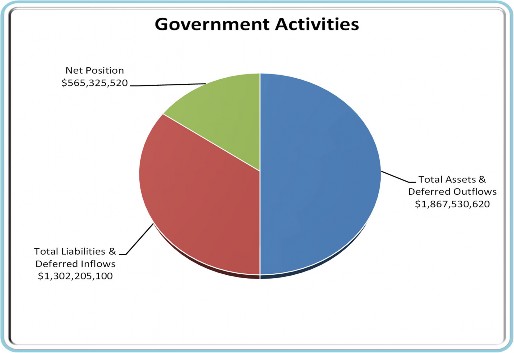
$ 565,325,520 $ 572,466,576
|
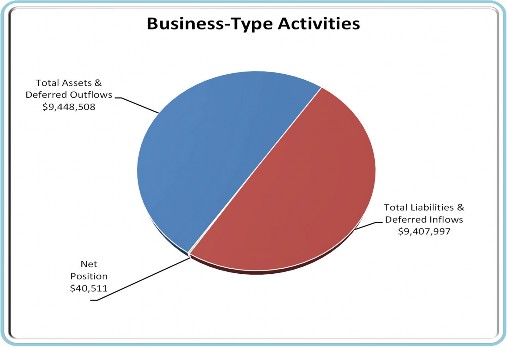
$ 40,511 $ 31,144
| |||
$ 565,366,031 | $ 572,497,720 | |||
The cost of the governmental and business activities this year was $902.8 million. Some costs were paid by those who benefited from the program ($12.7 million), or by other governments and organizations who subsidized certain programs with grant and contributions ($108.4 million). Operating grants increased primarily from revenue received from the CARES Act to facilitate assistance and relief in response to the COVID-19 pandemic. The District paid for the remaining portion of the governmental activities with $200.4 million in property taxes, $36.7 in Sales Tax, $506.1 state and categorical funds and $31.3 million in other general revenue.
Property taxes increased $7.8 million or 4.08 percent, which is primarily attributed to a 7.02 increase in property values and Sales Tax Revenue increased $4.6 million or 14.36 percent, which represents the impact of a population increase in Pasco County.
Investment earnings decreased by $6.6 million or 94.7 percent as a result of lower interest rates due to current market conditions.
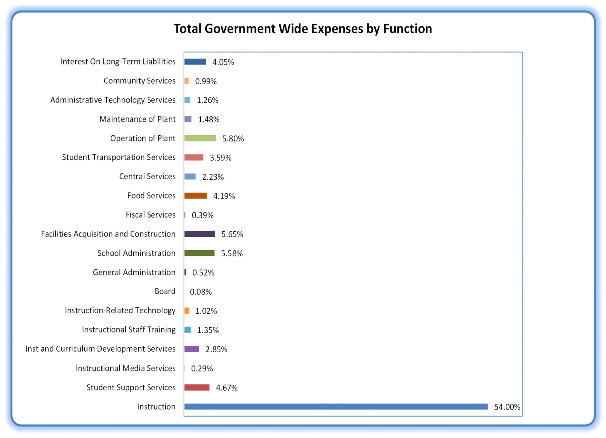
The chart below represents total expenses classified by function.